Utilization graphs and meters
The appliance gathers and reports CPU, memory, power consumption, temperature, health, and capacity data for certain resources via utilization graphs and utilization meters.
The minimum data collection interval is five minutes (averaged), each taken at 10 second intervals, and the maximum is one hour (averaged).
Utilization graphs can display a range of data up to a maximum of three years.
The appliance displays utilization statistics in two locations, which you can use to view trends in resource metrics:
The Utilization panel that is displayed in the Overview for each resource. This view displays utilization meters for the metrics available for that resource.
- Utilization graphs on the Utilization screen.
Utilization statistics gathered by resource
Utilization metric | |||||||
|---|---|---|---|---|---|---|---|
Resource | CPU | Memory | Power | Temperature | Health | Custom | Capacity |
| Enclosures | ✓ | ✓ | ✓ | ||||
| Interconnects | ✓ | ✓ | ✓ | ✓ | ✓ | ||
| Racks | ✓ | ✓ | |||||
| Rack Managers (Chassis) | ✓ | ✓ | |||||
| Power Delivery Devices | ✓ | ||||||
| Server Hardware | ✓ | ✓ | ✓ | ✓ | |||
| Storage Systems | ✓ | ||||||
You can use the Interconnects screen to view utilization graphs that display data transfer statistics for interconnect ports. See Viewing data transfer statistics for uplink ports for more information See the online help for the Interconnects screen.
For information on the utilization statistics gathered for HPE Superdome Flex Server and HPE Superdome Flex 280 Servers, see Utilization metrics.
Utilization statistics and licensing
Utilization statistics and graphs are disabled for server hardware that does not have an iLO license assigned. See Licensing.
If utilization is disabled, the Utilization panel displays a message stating the reason it is disabled in the details pane for the unlicensed resource.
The Utilization view in the details pane
no data is displayed. If the utilization meter is in the
not set state, a grey meter with hash marks is displayed. The utilization meter displays the
not set meter in the following cases:
The page is loading and the data is not yet available.
There is no utilization data prior to the most recent five-minute collection period. There may be historic data in the utilization graphs.
Enclosures will not display temperature data if none of the server blades are powered on.
Utilization graphs
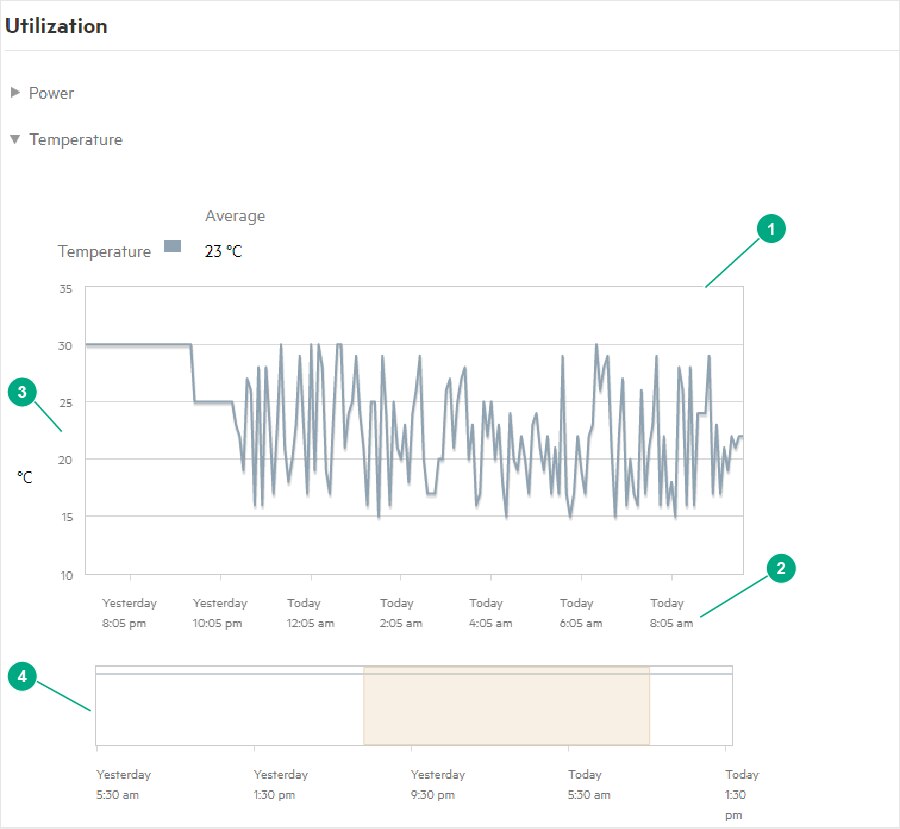
Primary graph: The large primary utilization graph displays metric data (vertical axis) for your devices over an interval of time (horizontal axis) using a line to graph data points.
Horizontal axis: The horizontal axis on the primary utilization graph depicts the time interval for the data being displayed, with the most recent interval data on the right. The minimum time interval is two minutes and the maximum is five days.
Vertical axis: The vertical axis on the primary utilization graph depicts the interval for the metric displayed in the corresponding unit of measurement down the left side of the graph. The interval for each unit of measurement is fixed and cannot be changed. Graphs that display two metrics with different units of measurement have a second interval down the right side of the graph. The measurement value at the top of the graph represents the maximum utilization capacity for a given metric.
Navigation graph: The navigation graph below the primary graph displays the maximum time interval of available data. Use the navigation graph to select the time interval you want to display in the primary graph by highlighting the interval with your pointing device.
See the online help for more information on creating a custom utilization graph and how to change the level of detail that the graph displays.